India Breathes
Live Air Quality & Seasonal Projections Dashboard
Determining...
Analyzing air quality metrics from environmental monitoring stations...
What does this mean for you?
General Population
Load air quality data to receive specialized precautions.
Sensitive Groups
Guidelines for children, elderly, and individuals with respiratory issues.
Gemini AI Advisor
AI health advisories will load once your Gemini API Key is configured. Click the gear icon in the header to get started!
Pollution Projections & Trends
Daily Pollution Cycles in Kolkata
Air quality in Kolkata follows distinct diurnal patterns. Typically, AQI peaks in the early morning (6:00 AM – 9:00 AM) and late evening (8:00 PM – 11:00 PM)...
Seasonal Cycle Insights
Click on any phase below to examine the meteorological factors causing changes in Kolkata's pollution in the coming months.
Loading Station...
Zone information...
Primary Source
Source description...
Mitigation Factor
Mitigation description...
Wind Direction Shifts
In winter, dry continental winds flow from the North-West, transporting pollutants from upper India. Conversely, during summer and monsoon, oceanic wind from the Bay of Bengal sweeps in, bringing clean air.
Thermal Inversion
During colder months (November–February), warm air acts as a lid over the cooler air near the ground. This thermal inversion traps traffic smoke, dust, and industrial particulate matter close to the surface.
Industrial & Traffic Load
Heavy commercial vehicle transit (diesel engines) through connecting highways and industrial activities in Howrah and surrounding districts contribute a steady baseline of fine particulates.
Gemini Assistant
AQI & Health AdvisorIndia Ecological Loss Atlas
Historical Biodiversity & Land Erosion Tracker (1959 – 2026)
India Ecological Health Map
Displaying forest cover depletion across India (Year: 1959)
India (National Average)
Southern Asia Region
Greenery Loss
Severe Erosion
Species Threatened
India Ecological Chart
Extinct & Rare Species Tracker
Most Vulnerable Regions (1959)
Pulse of the Ganges
An Ecological & Cultural Journey along India's Sacred River
River Flow Journey
Click city nodes or drag the slider below to inspect quality metrics every 100 km.
Varanasi
Water Health Index
Suitable for bathing and supports robust aquatic life.
Flow Rate
340 m³/spH Value
7.8Dissolved Oxygen
7.8 mg/LBOD (Oxygen Demand)
2.1 mg/LTurbidity
12 NTUTDS (Dissolved Solids)
240 mg/LE. coli Bacterial Count
950 MPN/100mlEcological Pulse
Cultural & Spiritual Pulse
Historical Chronicles
Varanasi is one of the oldest continuously inhabited cities in the world. The ghats here are the focus of spiritual devotion, where pilgrims perform cleansings, rituals, and the iconic Ganga Aarti ceremony at sunset.
India Breathes Mobile
Real-Time Environmental Diagnostics in the Palm of Your Hand
Take the power of environmental monitoring with you. The India Breathes native Android application provides immediate, geofenced tracking of air pollution indices, predictive weather correlations, and personalized health recommendations based on localized station parameters.
Health Advisory
Extreme particulate density. Avoid outdoor physical exposure. Wear N95 masks if exiting residential limits.
Project North East
Blue Gold in the Backyard: Sustainable Aquaculture & Integrated Farming Model
Adjust parameters to simulate how agricultural/aquacultural resource utilization and cold chain logistics investments scale food production and socio-economic outcomes.
Simulation Scenarios
Select a State
Aquaculture & Integrated AgricultureHover over or click any state on the map of Northeast India to inspect its specific environmental assets, aquaculture capacity, integrated farming patterns, and strategic potential.
Food Production Breakdown (Lakh Tonnes)
Integrated Farming Distribution
High-Yield Breeds & Pisciculture Varieties
Implementing genetically improved and select breeds increases regional productivity without expanding land or water footprints.
| Sector | Recommended Breed / Variety | Key Advantages | Yield Improvement |
|---|---|---|---|
| Pisciculture (Fish) | Jayanti Rohu & Amur Carp | Genetically selected variants; faster growth rate, higher disease resistance, and better feed conversion. | +18% to +30% yield |
| Pisciculture (Catfish) | Pabda & Singhi | High market value; thrives in shallow wetlands and integrated paddy-fish systems. | +25% net revenue |
| Poultry (Chicken) | Vanaraja & Kuroiler | Dual-purpose free-range birds; high resistance to local viral diseases, fast growth, and tasty meat. | 160-180 eggs/yr (vs 40 desi) |
| Poultry (Ducks) | Khaki Campbell | Excellent egg layers; highly compatible with integrated duck-fish farming (pesticide/fertilizer cycle). | 280-300 eggs/yr (vs 80 desi) |
| Dairy (Milk) | Jersey & HF Crossbreds | Crossbreds adapted to humid hills; high lactation period and higher fat milk content. | 8-12 L/day (vs 2L local) |
High-Efficiency Irrigation Systems
Adapting water management systems to mountain terrain ensures crop security across seasons while avoiding soil degradation.
| Irrigation System | Terrain / Application | Operational Mechanism | Efficiency & Impact |
|---|---|---|---|
| Bamboo Drip Irrigation | Steep hill slopes (e.g. Meghalaya) | Traditional 200-year-old system using split bamboo channels to carry spring water drop-by-drop directly to plant roots. | Zero-energy cost; 90% water saving |
| Solar-Powered Lift | River banks & low-lying valleys | Lifting water from the Brahmaputra/Barak river beds using floating solar pump arrays up to terraced valley farmlands. | +40% crop yield in dry season |
| Micro-Sprinklers & Drip | Slope orchard plantations (Ginger, Oranges) | Pressurized water delivered slowly; prevents surface soil washing, preserves slope stability, and targets fertilizer placement. | Reduces soil runoff by 60% |
| Zabo Water Harvesting | Hilly terrace farms (Nagaland) | Rainwater collected in hilltop ponds, routed through cattle enclosures for organic manuring, and fed into terraced paddy-cum-fish fields. | Dual crop-fish water security |
Dairy Processing & Regional Milk Products
Processing raw milk into high-value dairy commodities ensures stable incomes for hill farmers and bridges nutrition gaps.
| Milk Product | Target Dairies & Cooperatives | Processing Mechanism | Shelf Life & Preservation |
|---|---|---|---|
| Liquid Pouch Milk | Purabi (WAMUL - Assam), Gomati (Tripura) | Pasteurization and homogenization in large centralized municipal cooperatives. | 2 - 3 Days (Requires continuous cold chain) |
| Chhurpi (Traditional Cheese) | Sikkim Milk Union, Kameng Dairy (Arunachal) | Coagulated buttermilk boiled, pressed, and hung to ferment, then smoke-dried over wood. | Up to 4-5 Years (Extremely stable without refrigeration) |
| Clarified Ghee & Butter | Hill Cattle Cottage Cooperatives | Butter churned from curdled milk, slowly clarified to evaporate moisture. | 8 - 12 Months (Highly stable in room temperatures) |
| Paneer & Sweet Dahi | Guwahati and Shillong Urban Dairies | Acid coagulation of hot milk (Paneer) and lactic fermentation of boiled milk (Dahi). | 5 - 7 Days (Requires localized refrigeration) |
Cattle & Bovine Husbandry Systems
Integrating indigenous bovines and crossbred cattle into hill and valley farming secures draft power, organic manure, and high-yield protein.
| Bovine Class | Target Altitude & States | Ecological Integration | Yield & Products |
|---|---|---|---|
| Mithun (Gayal) | Forest slopes (Arunachal, Nagaland, Manipur, Mizoram) | State animal of Nagaland/Arunachal. Thrives on free-range forest browsing; zero feed footprint, forest-compatible. | Premium organic meat & high-fat milk |
| Himalayan Yak | High altitude alpine zones (Sikkim, Arunachal) | Adapted to extreme cold. Migratory grazing; converts alpine grasses to high-fat milk, butter, and wool. | Raw material for premium Sikkim Chhurpi |
| Siri Hill Cattle | Mid-altitude hills (Sikkim, Meghalaya) | Extremely hardy indigenous breed; draft power for mountain terrace plowing and resilient to local ticks. | Draft power & creamy high-fat milk |
| Jersey & HF Crossbreds | Valley plains & urban margins (Assam, Tripura) | Centralized stall feeding; highly responsive to veterinary care and feed concentrates in commercial dairies. | Primary source of fresh urban liquid milk |
Pig & Goat Farming Opportunities & Revenues
Piggery and goatery represent massive domestic demand in the Northeast, generating high-velocity cash flows for smallholder farms.
| Livestock Class | Preferred Breeds | Integrated Farming Opportunity | Socio-Economic Leverage |
|---|---|---|---|
| Piggery (Pigs) | Hampshire, Large Black, Ghungroo | Pig-fish integration: Pig sties constructed over fish ponds; washings serve as zero-cost fertilizer for pond algae. | High local consumer base; generates high-profit margin per household. |
| Goatery (Goats) | Assam Hill Goat, Black Bengal | Scrubland silvopasture grazing: Feeds on hilly steep vegetation, highly compatible with forest buffer zone borders. | High twinning rates (Assam Hill Goat) and premium meat quality & skin value. |
Logistics Flow Simulator: Farm to National Table
Rail Corridors
Connecting Dimapur, Guwahati, and Siliguri to mainland Indian terminals via dedicated refrigerated rail cargo coaches (Kisan Rail).
Brahmaputra Waterways
Inland water transport (National Waterway 2) utilizing Ro-Ro ships and barges to ship high-bulk agricultural yield downstream.
Air Cargo Corridors
Krishi Udan schemes facilitating air shipment of highly perishable, premium products like ornamental fish and organic spices to national capitals.
National Feeding Capacity
People fed yearly with protein-rich surplus
By optimizing freshwater fisheries and utilizing uncultivated land, Project North East can supply sufficient proteins (fish, poultry, duck) and staple crops to feed a large segment of India's population.
Livelihoods Created
1.8 Lakh JobsDirect jobs for fishers, farmers, and cold chain managers.
Annual Revenue Generated
₹1,850 CroreIncome infused directly into rural economies of Northeast states.
Protein Import Reduction
34.2%Reduces dependence of mainland states on distant fish imports.
Project North East: Strategic Development Framework
A multi-sectoral assessment of resources, industries, safeguards, and financial investments required to transform the Northeast into India's organic food corridor.
Current Major Products
Traditional capture fisheries, local paddy, ginger, citrus fruits, raw cow milk, backyard poultry, and traditional bamboo baskets.
Untapped Resources
7.2 Lakh hectares of uncultivated lands, mountain trout streams, endemic ornamental fish, and premium high-curcumin turmeric crops.
Suggested New Industries
Organic ginger/turmeric oil extraction plants, centralized fish-feed mills, silk weaving digitizing centers, and tea blending houses.
Employment Potential
Job avenues for hatchery technicians, cooperative managers, logistics drivers, cold-chain operators, and craft weavers.
Export Opportunities
Supply of Muga silk to international luxury brands, organic spices to EU markets, and ornamental fish to East Asian countries.
Infrastructure Needs
Solar-powered pumps, deep-freeze cold storage clusters, inland water barges, and specialized rail transport containers.
Environmental Safeguards
Prevention of hillside soil erosion, protection of Brahmaputra spawning channels, and strict zero-chemical runoff mandates.
Investment Opportunities
Public-Private Partnerships (PPP) in cold logistics, organic tea cooperatives, eco-resort circuits, and certified hatcheries.
Total Investments Required
Estimated capital required to deploy the selected level of agriculture, cold chains, transport links, tourism, and craft support.
Tourism Infrastructure & Local Industries
Combining ecotourism with indigenous handicrafts leverages the cultural identity of Northeast India to drive high-margin rural growth.
| Sector | Target Locations & Hubs | Strategic Infrastructure Needed | Revenue & Export Potential |
|---|---|---|---|
| Ecotourism & Festivals | Hornbill Circuit (Nagaland), Living Root Bridges (Meghalaya), Ziro Valley (Arunachal) | Homestay upgrades, clean green toilet amenities, high-altitude trail signage, and local tourist guide cooperatives. | ₹6,000 avg spend per domestic visitor |
| Angling & Sport Fishing | Kameng River (Arunachal), Umngot River (Meghalaya), Jia Bhoroli (Assam) | Catch-and-release licensing platforms, eco-resort fishing camps, river patrolling against electrofishing. | High-value angling tourists (₹15k/day spend) |
| Muga & Eri Silk Weaving | Sualkuchi (Silk Town of Assam), Upper Assam villages, Ri-Bhoi (Meghalaya) | Modern handloom integration, solar-powered winding machines, design studios, and direct-to-consumer digital markets. | Muga Silk commands ₹30,000/saree in mainland |
| Bamboo & Cane Crafts | Tripura clusters, Mizoram bamboo parks, Nagaland bamboo mission | Common facility centers with seasoning chambers, sizing/splitting machines, and eco-friendly treatment units. | Eco-friendly straws, furniture, and kitchenware exports |
State-wise Strengths & Resource Profiles
Leveraging the unique ecological and industrial advantages of each of the 8 sister states.
Tea, Petroleum & Bio-Resources
World's largest tea grower, natural gas reserves, extensive bamboo forests, emerging biotech hubs, and major river logistics gates.
Hydropower, Kiwi & Eco-Tourism
India's future powerhouse with massive small hydro potential, largest producer of organic kiwi, exotic orchids, and wilderness trekking.
Spices, Horticulture & Music
Famous for Lakadong turmeric (highest curcumin), organic ginger, wild mushrooms, living root bridge ecotourism, and cultural festivals.
Bamboo, Handicrafts & Organic Crops
Extensive bamboo forest coverage, Hornbill cultural festival circuit, organic agricultural products, and premium handlooms.
Sports Goods, Handlooms & Floriculture
Country's sports powerhouse, exquisite handlooms (Manipuri sarees), orchid floriculture, and growing IT service centers.
Bamboo Industry & Agro-Processing
High concentration of structural bamboo species, tropical fruit plantations (passion fruit, banana), and wooden furniture design.
Natural Gas, Rubber & Agarwood
Largest producer of natural rubber after Kerala, high-purity natural gas reservoirs, premium agarwood, and cane handicraft hubs.
Organic Agriculture & Pharma Hub
India's first 100% organic state, high-altitude cardamom leader, premium pharmaceuticals, and high-value sustainable mountain tourism.
15 Key Strategic Industry Clusters
The industrial taxonomy mapping the region's raw assets to commercial processing, export gateways, and technological sectors.
| Cluster Category | Primary Raw Materials / Products | Suggested Industry & Opportunities |
|---|---|---|
| 1. Organic Agri-Spices | Kiwi, avocado, dragon fruit, berries, Lakadong turmeric, ginger, black pepper, large cardamom, specialty coffee, medicinal herbs, exotic mushrooms, bamboo shoots. | Freeze-drying packaging plants, juice and beverage processing factories, spice oil/curcumin extraction units, and high-altitude mushroom spawn hubs. |
| 2. Bamboo & Cane | Structural bamboo species, cane vines. | Engineered bamboo boards, premium furniture cooperatives, eco-friendly food packaging, toothbrushes, bamboo textiles, and biodegradable cutlery. |
| 3. Medicinal & Herbal | Taxus baccata, wild ginger, high-altitude herbs. | Herbal medicine units, organic nutraceutical products, botanical cosmetics, essential oil extraction, and aromatherapy blends. |
| 4. Renewable Energy | Mountain water streams, biomass/bamboo residues, sunlight. | Small hydro power stations, micro-solar grids, bamboo biomass pellet manufacturing, battery storage assembly, and solar panel components. |
| 5. Fisheries & Aquaculture | Coldwater trout streams, floodplains (beels), ornamental fish. | Mountain trout raceways, ornamental fish breeding nurseries, integrated fish-duck-paddy ecosystems, and shrimp processing. |
| 6. Sericulture & Textiles | Muga & Eri silk cocoons, organic cotton, natural dyes. | Premium gold Muga silk handloom weaving, natural dyes extraction, luxury fashion export garments, and organic home furnishings. |
| 7. Food Processing | Pineapple, orange, jackfruit, banana, passion fruit. | Agro-processing units for jams, local wines, organic fruit vinegar, ready-to-eat items, and dehydrated fruit snacks. |
| 8. Forest Products | Wild honey, beeswax, wild mushrooms, lac, natural resins. | Premium organic honey exports, natural beeswax cosmetic manufacturing, and industrial varnishes using local resins/lac. |
| 9. Ecotourism & Wellness | Rivers, lakes, tribal culture, living bridges, orchids. | Eco-lodge franchises, adventure sports circuits, angling base camps, tribal heritage cultural festivals, and high-altitude wellness retreats. |
| 10. IT & Knowledge | Skilled youth, digital connectivity. | Software development agencies, AI startup incubators, GIS remote sensing centers, BPO/call centers, and animation/media studios. |
| 11. Electronics Assembly | Semiconductor parts, local sensors. | LED bulb assembly plants, mobile accessories, drone components manufacturing, and localized soil/aquatic agricultural sensors. |
| 12. Trade Logistics | Borders with Bhutan, China, Myanmar, Bangladesh. | Export cold warehouses, cargo holding hubs near border points, trans-shipment logistics parks, and trade corridors. |
| 13. Bioeconomy | Agricultural wastes, biomass residue, algae. | Bioplastics, biofertilizers, biofuels, local yeast fermentation units, and high-protein algae cultivation. |
| 14. Research & Education | Regional ecosystems, mountain terrain. | Biotech research institutes, climate change studies centers, bamboo engineering labs, and AI research campuses. |
| 15. Strategic Mfg | Defense components, agricultural sensors. | Disaster-management equipment manufacturing, drone construction assembly, and satellite sensor components. |
Development Sundarbans
Mangrove Restoration & Coastal Delta Resilience Simulation Model
The long-term vision for the Indian Sundarbans is to create a "Green Resilient Sundarbans"—a model region where ecological conservation balances with sustainable human development.
Clean Energy
Reliable clean energy for every village.
Water & Health
Access to safe drinking water and healthcare for every household.
Local Employment
Local jobs for youth to halt seasonal migration.
Sustainable Income
Stable, green incomes for farmers and fishers.
Women's Opportunity
Strong economic and leadership opportunities for women.
Tiger Conflict Mitigation
Non-lethal tech (solar fencing, smart sensors, drone patrols) to protect lives.
Thriving Biosphere
Mangrove forests and wildlife continue to thrive while fully supporting local communities.
Adjust parameters to simulate how environmental funding, community electrification, and coastal defenses impact carbon storage, biodiversity, and regional stability.
Preset Development Scenarios
Sundarbans Delta Zone Explorer
Hover over or click the delta zones on the map to inspect conservation priority levels, regional vulnerabilities, and policy details.
Resilience Index vs. Sea Level Rise Vulnerability
Species Health Index (Relative Populations)
Net atmospheric CO₂ equivalent stored by mangroves
Delta immunity score against cyclones & soil washing
Estimated Royal Bengal Tigers in Biosphere Reserve
Community members supported by green sector jobs
Revenue from honey co-ops, crab exports, and ecotourism
Electrified remote island households utilizing off-grid solar
Mangrove Honey Cooperative
Providing protective gear, processing facilities, and fair trade pricing to 'mouleys' (traditional honey collectors) to minimize deep forest wildlife exposure.
Eco-Friendly Crab Rearing & Fattening
Deploying low-impact bamboo cages in community canals. A high-yield alternative that prevents embankment destruction and deters mangrove cutting.
Salt-Tolerant Rice Cultivation
Promoting indigenous 'Hamilton' and 'Dudheswar' salt-resistant paddy strains to safeguard farm income after saline storm surges breach earthen embankments.
Sundarbans' long-term habitability relies on transitioning from reactive disaster relief to proactive, climate-resilient economic growth models across 25 strategic sectors.
| Development Cluster | Primary Interventions & Projects | Estimated Cost | Funding & Strategic Scope (2026-2030) |
|---|---|---|---|
| 1. Renewable Energy | Village-level solar microgrids, solar-powered irrigation pumps, solar drinking water purification plants, solar street lighting, solar cold storage for fish and vegetables, micro-wind turbines, solar boat charging stations, and hybrid solar-wind community grids. | ₹220 Crore | Multi-sector financing via clean energy funds, corporate partnerships, and decentralized smart metering. |
| 2. Drinking Water & Health | Household rainwater harvesting systems, community solar desalination plants, mobile boat medical clinics, telemedicine centres connected to city hospitals, maternal & child care, snakebite treatment units, mental health counselling, and emergency evacuation boats. | ₹145 Crore | Supported by National Health Mission, UNICEF grants, and state rural health allocations. |
| 3. Education | Smart classrooms, rural digital libraries, computer education from primary schools, vocational training centers, talent scholarships, boat schools for remote islands, adult literacy programs, and environmental mangrove conservation curriculum. | ₹95 Crore | Public-private partnerships, corporate IT CSR sponsors, and community school trusts. |
| 4. Agriculture | Salt-tolerant rice varieties (Hamilton, Dudheswar), fully organic farming certification, floating vegetable gardens, climate-resilient farming systems, elevated orchards, medicinal plant nurseries, drip irrigation, and farmer marketing cooperatives. | ₹80 Crore | Nabard funding, agricultural technology subsidies, and rural cooperative loans. |
| 5. Pisciculture & Fisheries | Scientific fish farming models, sustainable crab farming, mud crab fattening yards, prawn hatcheries, integrated fish-rice farming, open-water cage fish culture, fish feed production, and cold-chain transport networks. | ₹130 Crore | PM Matsya Sampada Yojana subsidies, commercial fishing associations, and export trade credits. |
| 6. Livestock | Backyard duck farming, goat rearing, backyard poultry cooperatives, indigenous cattle genetic improvement, veterinary centers, and fodder cultivation. | ₹55 Crore | Self-Help Group (SHG) micro-loans and livestock insurance programs. |
| 7. Honey & Forest Produce | Scientific beekeeping, honey processing & filtration units, branding of Sundarbans Honey, sustainable NTFP (Non-Timber Forest Product) collection, and medicinal herb collection safeguards. | ₹40 Crore | Joint Forest Management Committees (JFMCs) and fair-trade organic certification organizations. |
| 8. Eco-Tourism | Community-owned eco-lodges, guided mangrove boat tours, bird watching camps, cultural tourism programs, homestay networks, kayaking circuits, nature interpretation centers, and local handicraft markets. | ₹75 Crore | Ecotourism cooperative boards, community-run tourism packages, and state tourist development aids. |
| 9. Employment Generation | Bamboo craft cooperatives, jute product manufacturing, coconut processing, fish processing & dehydration plants, food preservation units, solar equipment maintenance training, boat building & repair yards, and rural BPO centers. | ₹90 Crore | MSME cluster development grants and rural industrialization schemes. Halts seasonal migration. |
| 10. Women's Empowerment | Self-help groups (SHGs), microfinance credit lines, tailoring units, food processing enterprises, handicrafts production, mushroom cultivation hubs, and digital literacy classes. | ₹60 Crore | Direct benefit transfer schemes, state women development corporations, and microfinance networks. |
| 11. Disaster Management | Cyclone-resistant housing, raised cyclone shelters, elevated schools, community disaster response teams, early warning systems, elevated evacuation roads, and emergency communication networks. | ₹380 Crore | National Disaster Response Fund (NDRF) capital allocation and World Bank climate resilience loans. |
| 12. Coastal Protection | Large-scale mangrove restoration, bio-shields using native vegetation, eco-friendly embankments, living shorelines, riverbank stabilization, and wetland restoration. | ₹450 Crore | Central climate adaptation funds, international carbon credits, and environmental bio-shield allocations. |
| 13. Tiger Conflict Mitigation | Non-harmful solar-powered fencing around vulnerable villages, smart sensor-based warning systems, AI camera traps for early detection, drone monitoring, rapid response teams, livestock loss compensation, and predator-proof cattle sheds. | ₹70 Crore | Project Tiger central funding, Global Tiger Forum, and international conservation organizations (WWF). |
| 14. Transport | Solar-powered ferries, electric boats, better concrete jetties, floating pontoons, GPS navigation for waterways, and emergency ambulance boats. | ₹125 Crore | Inland Water Transport subsidies, state green vehicle transition schemes, and private ferry operations. |
| 15. Digital Connectivity | High-speed internet, mobile towers with renewable energy backup, digital service centers, online education services, online banking facilities, and digital governance tools. | ₹85 Crore | Universal Service Obligation Fund (USOF) and private telecom network expansion. |
| 16. Waste Management | Plastic-free village declarations, solid waste segregation, composting units, plastic recycling plants, waste collection boats, and community biogas plants. | ₹45 Crore | Swachh Bharat Mission (Grameen) and corporate recycling sponsorships. |
| 17. Food Processing Industries | Fish drying & packaging, pickle production clusters, coconut product manufacturing, mango processing, palm products, honey packaging plants, and spice grinding cooperatives. | ₹65 Crore | Ministry of Food Processing Industries (MoFPI) cluster grants and agricultural export zones. |
| 18. Research & Innovation | Climate research stations, biodiversity monitoring, mangrove restoration research, salinity monitoring networks, water quality laboratories, and citizen science programs. | ₹50 Crore | Central university collaboration research grants and global climate research bodies. |
| 19. Financial Inclusion | Banking correspondents, insurance coverage (crop/fishermen), digital payment systems, and affordable micro-credit lines. | ₹35 Crore | Led by public sector banks, rural micro-credit systems, and rural insurance frameworks. |
| 20. Skill Development | Solar technician training, electric boat maintenance, hospitality & tourism training, fisheries management, entrepreneurship courses, computer programming, and GIS & drone operations. | ₹50 Crore | National Skill Development Corporation (NSDC) certifications and state vocational training boards. |
| 21. Infrastructure | Elevated roads where environmentally appropriate, climate-resilient bridges, flood-resistant housing, community halls, and solar-powered public buildings. | ₹280 Crore | Rural Infrastructure Development Fund (RIDF) capital investment. |
| 22. Biodiversity Conservation | Community mangrove nurseries, wildlife monitoring, dolphin conservation, bird habitat protection, sea turtle conservation, and community forest management models. | ₹55 Crore | Wildlife preservation endowments, community forest rights, and biodiversity management committees. |
| 23. Local Industries | Bamboo furniture, handwoven mats, coconut fibre products, herbal products, natural dyes, and eco-friendly packaging. | ₹40 Crore | Khadi and Village Industries Commission (KVIC) support. |
| 24. Climate Adaptation | Salinity-resilient livelihoods, floating agriculture, water conservation, carbon credit programmes through mangrove restoration, and community climate adaptation plans. | ₹90 Crore | Adaptation Fund under UNFCCC and global carbon registries. |
| 25. Governance & Community Participation | Village development committees, community-owned renewable energy projects, participatory budgeting, women's leadership programmes, youth conservation brigades, and transparent digital governance. | ₹30 Crore | Decentralized planning and panchayat-level community empowerment funds. |
Darjeeling Tea Ecosystem Overview
Key Performance Indicators & Interactive Estate Mapping
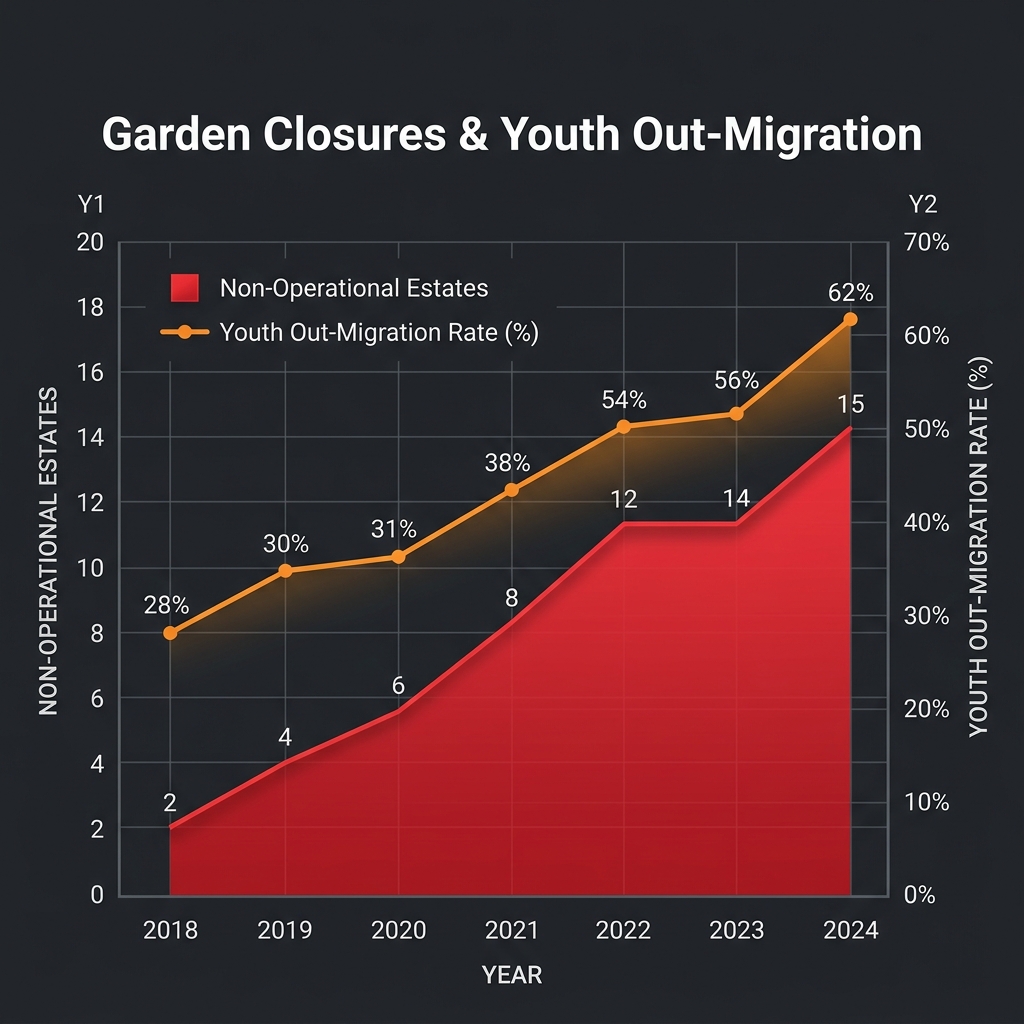
72 / 87 Gardens
15 closed or sick gardens
7.8 Million kg
55% export percentage
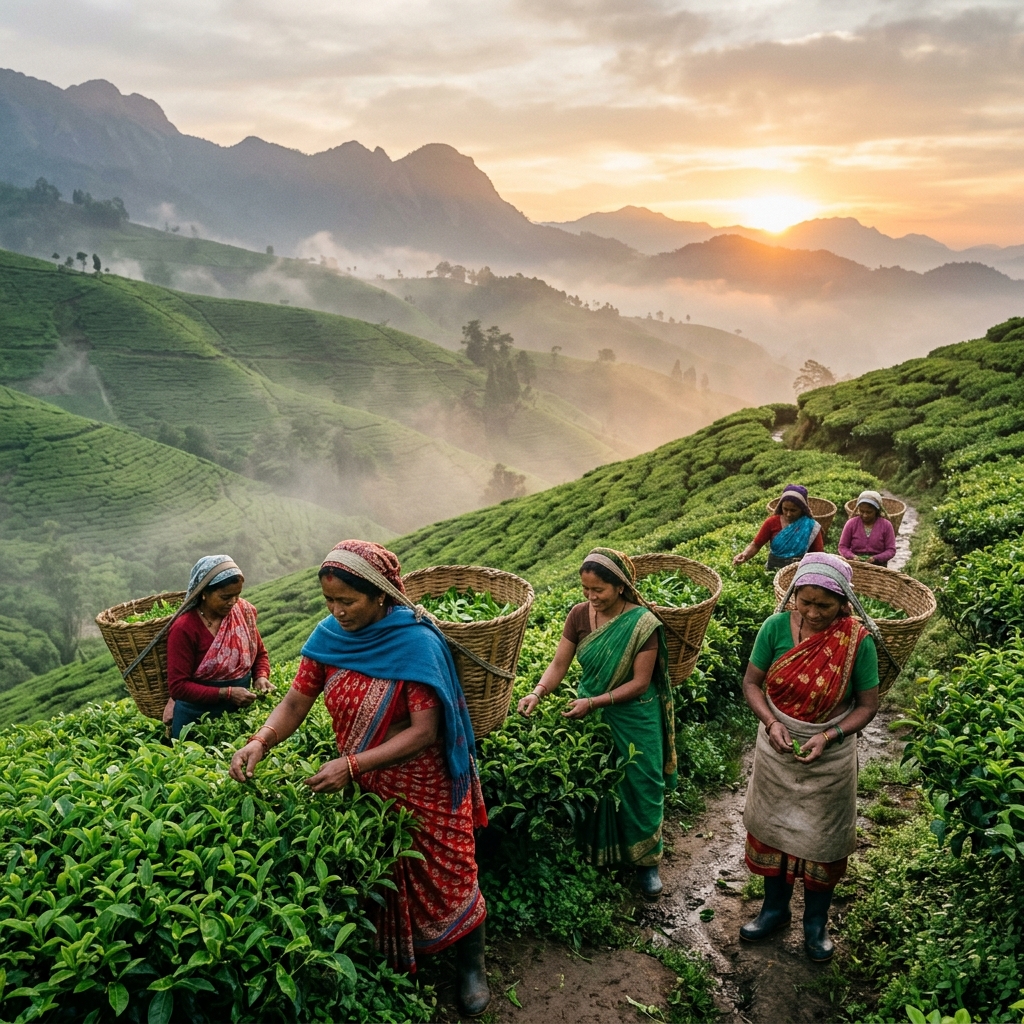
55,000 Pluckers
65% female workforce
45% Certified
Targeting 100% biodynamic
Select an estate group pin to load regional observations, topography, and landslide susceptibility levels:
Makaibari Estate
Biodynamic ReserveMiddle Altitude Forest Buffer Zone (Elev: 1,200m)
Makaibari is the oldest tea estate in Darjeeling. Nestled in a rich sub-tropical forest area, it features a unique combination of organic agricultural land and native forest buffers, supporting local bird species and providing shelter for wild leopards and Red Pandas.
Active Model Projections
Historical Journey & GI Designation
Tracing the evolution of Darjeeling Tea from 1850s to global fame
Just like Champagne can only be produced in the Champagne region of France under strict appellation rules, authentic Darjeeling tea can only be grown and manufactured in the hilly regions of the Darjeeling district of West Bengal, India.
The unique microclimate—defined by steep elevations (up to 2,000 meters), heavy mountain mists, cool temperatures, and acidic soils—causes the tea leaves to grow slowly, concentrating essential oils. This results in the famous muscatel flavor (a complex, grape-like, floral aroma with spicy undertones) and a bright, thin-bodied, copper-golden liquor that cannot be replicated anywhere else in the world.
Strict compliance rules are governed by the Tea Board of India. To carry the official Darjeeling Tea logo, the tea must be 100% grown, harvested, and processed within the designated subdivisions of Darjeeling and Kurseong.
Despite these protections, over 40 million kg of tea are sold globally as "Darjeeling" annually, while the actual production of authentic Darjeeling tea rarely exceeds 8 million kg. This creates severe price dilution and damages its premium global reputation.
- European Union: Highly prized in Germany, France, and the UK. Awarded protected status in the EU.
- Japan: Celebrated for first-flush green and black teas, fetched at high prices at specialty tea auctions.
- United States: Rapidly growing demand in organic specialty loose-leaf markets.
Causes of Decline & Environmental Vulnerabilities
Structural crisis, climatic shifts, and ecological degradation in the hills
Rainfall Inconsistency
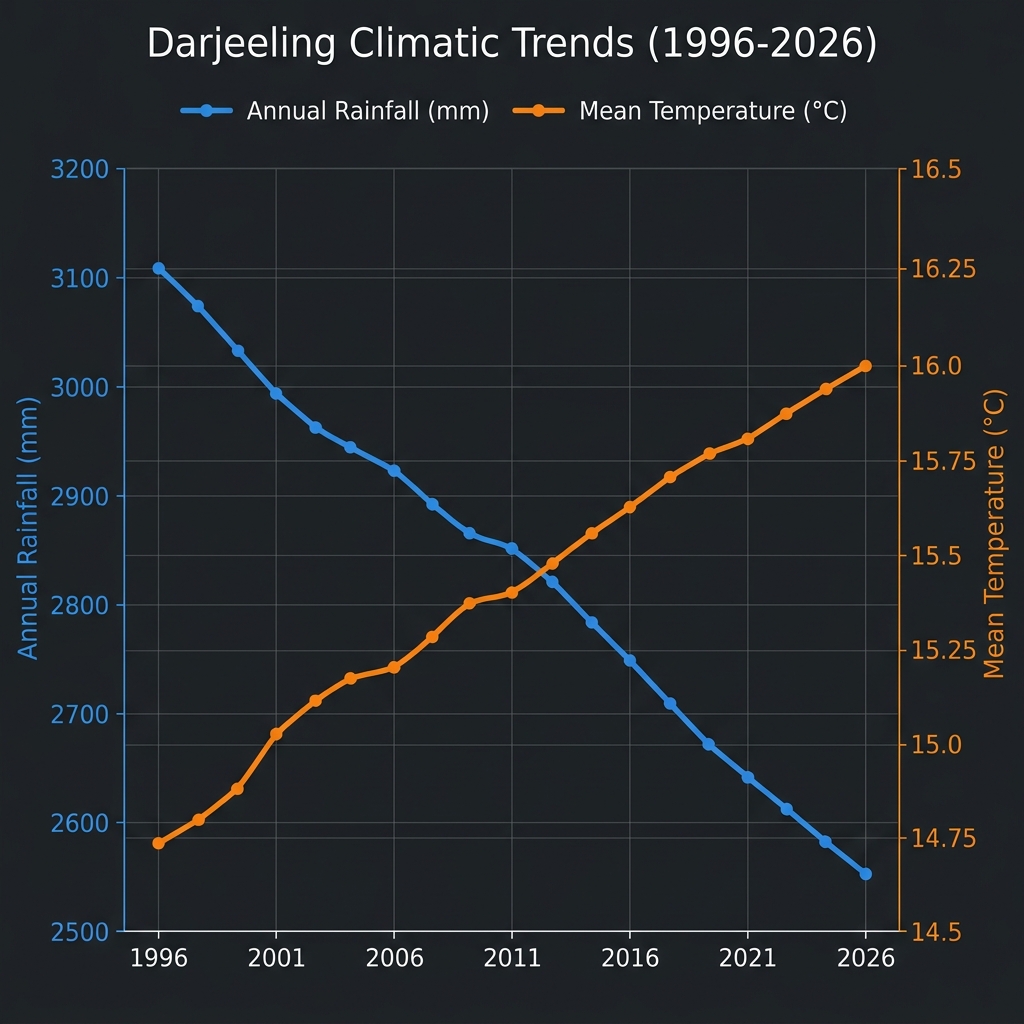
High RiskDarjeeling has seen an average annual rainfall decline of 18% over the past 25 years. Monsoons are compressed into sudden, intense spells, causing high runoff, while winter drought months are prolonged.
Slope Landslides
Active ThreatIntense torrential rainfall triggers severe soil washouts on deforested hill slopes. Estates with poor terracing and lack of deep-rooted shade tree canopies suffer devastating loss of topsoil.
Temperature Rise
Modelling RiskThe average mean temperature in Darjeeling has climbed by 1.2°C, encouraging insect pests like thrips and red spider mites to spread to higher altitudes where they were historically absent.
Water Scarcity
High RiskDue to deficient spring water networks and lack of reservoir storage infrastructure, estates face critical drinking and irrigation water shortages during the dry pre-monsoon first-flush season (March-May).
Worker Demographics
- Total Workforce: 55,000 workers
- Permanent Employees: 60% of workforce
- Seasonal Pluckers: 40% (high flush season)
- Women representation: 65% (primary pluckers)
Housing & Healthcare
- Housing Upgraded: 10% of quarters
- Potable water availability: Only 40%
- Health Centres status: Underfunded
- Child Malnutrition Rate: 35% average
Migration & Education
- Youth Outflow Migration: High (62%)
- School Enrollment: Approx. 68%
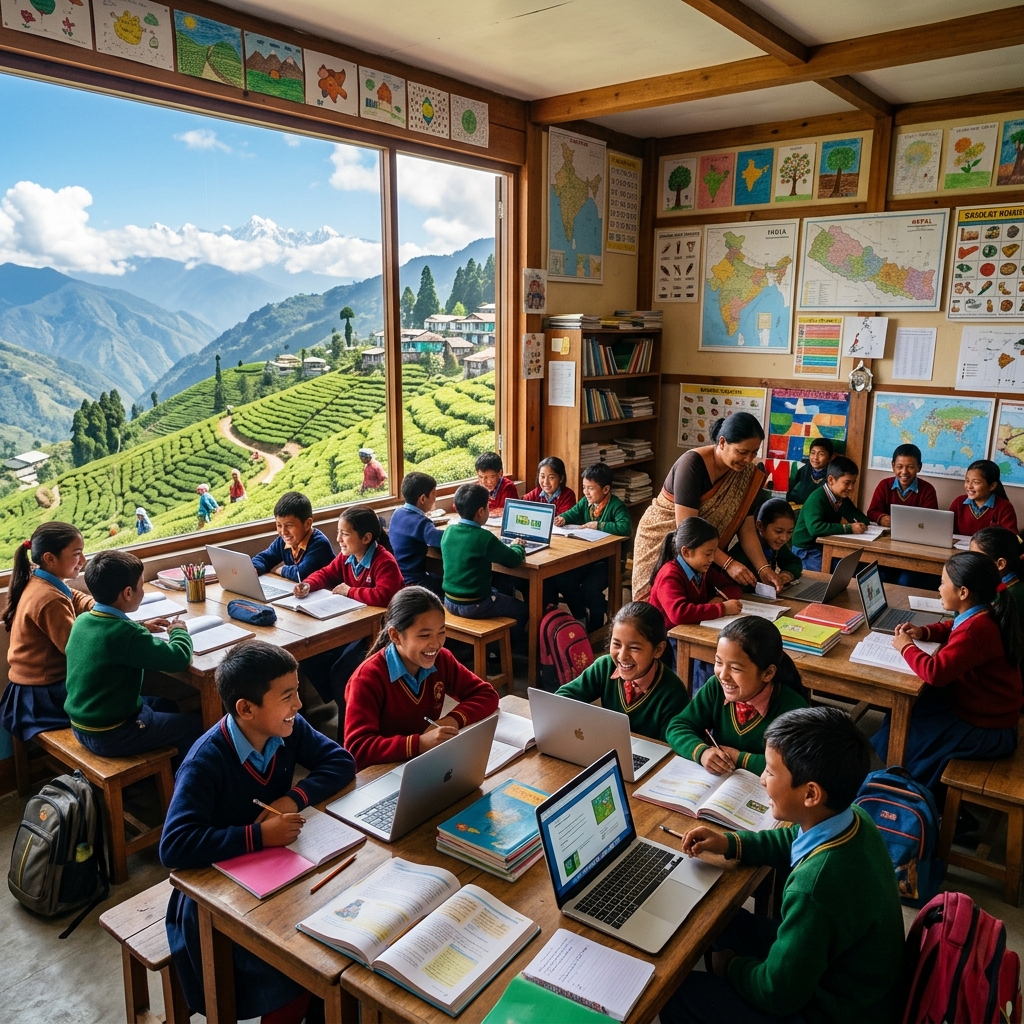
- Smart school centers: 4 operational
- Daily base wage: ₹250 / day
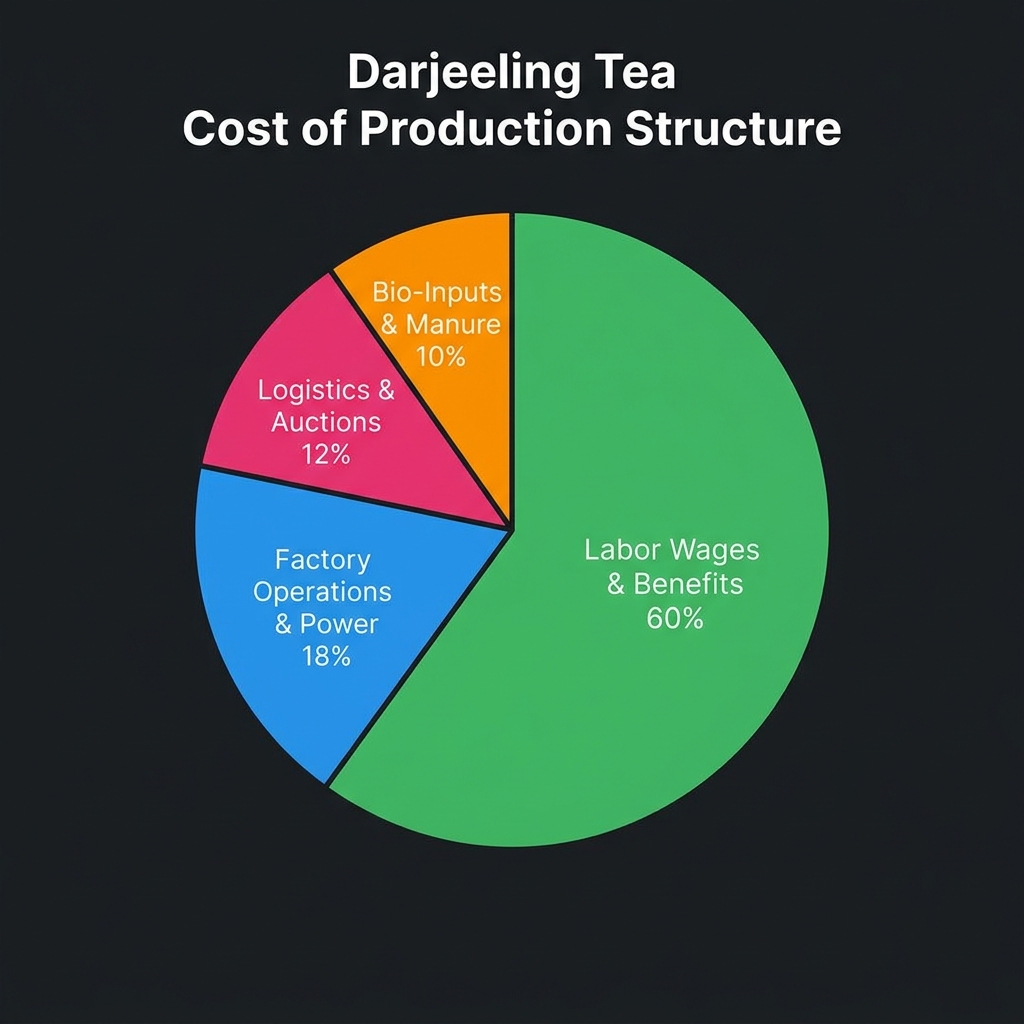
Economic & Financial Analysis
Production trends, auction rates, cost matrices, and global cost comparison
Notice the steady decline in annual production from 11 million kg in 1996 down to 7.8 million kg in recent years, alongside shrinking export percentages.
Average Production Cost: ₹420 - ₹450 / kg
Average Auction Sale Price: ₹380 - ₹430 / kg (Estates running at net operating losses)
| Country | Variety | Avg Cost (USD/kg) | Avg Auction (USD/kg) |
|---|---|---|---|
| India (Darjeeling) | Orthodox / Muscatel | $5.20 | $4.80 - $5.50 |
| Nepal (Ilam) | Orthodox (Similar elevation) | $2.10 | $2.80 - $3.40 |
| Sri Lanka | Ceylon High Grown | $2.80 | $3.50 - $4.00 |
| Kenya | CTC (High productivity) | $1.60 | $2.20 - $2.50 |
| China | Specialty Keemun/Green | $4.50 | $5.80 - $8.00 |
Modernisation & Value Addition
Technological pathways and high-margin product extensions to revive estates
Drone Monitoring & AI Disease Spotting
Deploy multi-spectral drone flyovers to detect early red spider mite infestations, crop stress, and soil erosion risk on steep cliffs, reducing manual field patrol costs.
Smart Drip & Contour Irrigation
Utilize gravity-fed drip lines matching contour terraces, minimizing run-off. Solves severe water scarcity during dry spring periods using captured monsoon waters.
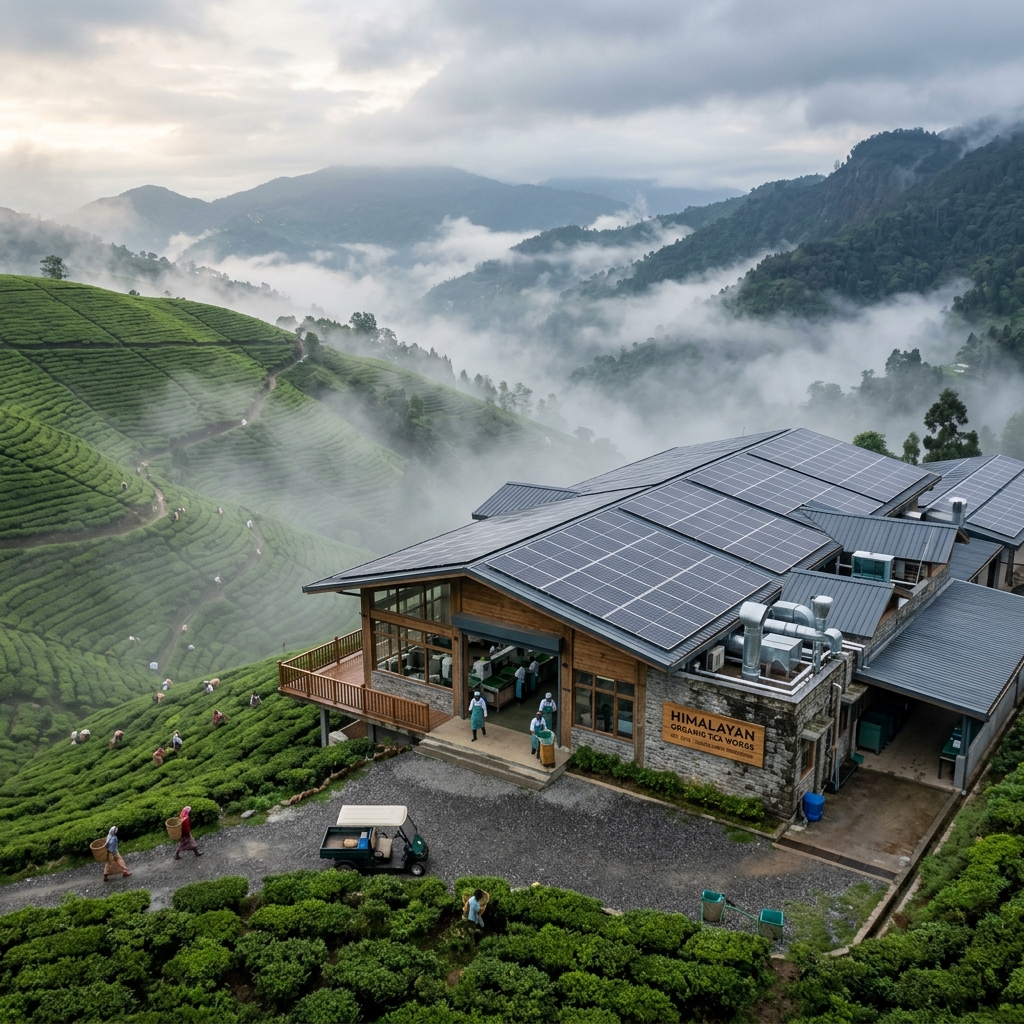
Solar-Powered Withering & Drying Mills
Install solar PV roofing grids on factories. Tea processing (specifically drying and withering) is power-intensive; solar backup offsets high local grid costs and fossil fuels.
Blockchain Traceability & Digital Auction
Track tea chests from estate pluck date to global shipment via a decentralized ledger, verifying authentic GI origin and bypassing middle-men to capture higher margins.
Exporting raw bulk tea leaves in chests offers low returns. Revitalising the financial state requires local packaging, blending, and product extension:
White & Green Teas
Minimal processing, rich in antioxidants. Fetches 3x the price of orthodox black tea.
Herbal Blends
Mixing Darjeeling leaves with local wild ginger, cardamom, and Himalayan rose petals.
Cosmetics & Essential Oils
Extracting polyphenols from tea waste for premium skincare, green tea creams, and wellness oils.
Tea Chocolates
Infusing first-flush muscatel profiles into high-quality organic dark chocolate bars.
Darjeeling's tea gardens offer spectacular vistas of Mount Kanchenjunga. Leveraging this for tourism creates direct supplementary revenue:
- Heritage Bungalows: Upgrading 19th-century colonial estate bungalows into premium luxury homestays.
- Tasting & Plucking Tours: Immersive tours where travelers pluck their own leaves and learn hand-rolling tea art.
- Eco-Trekking Trails: Guided nature trails connecting Makaibari to wildlife sanctuaries, raising awareness of the Red Panda.
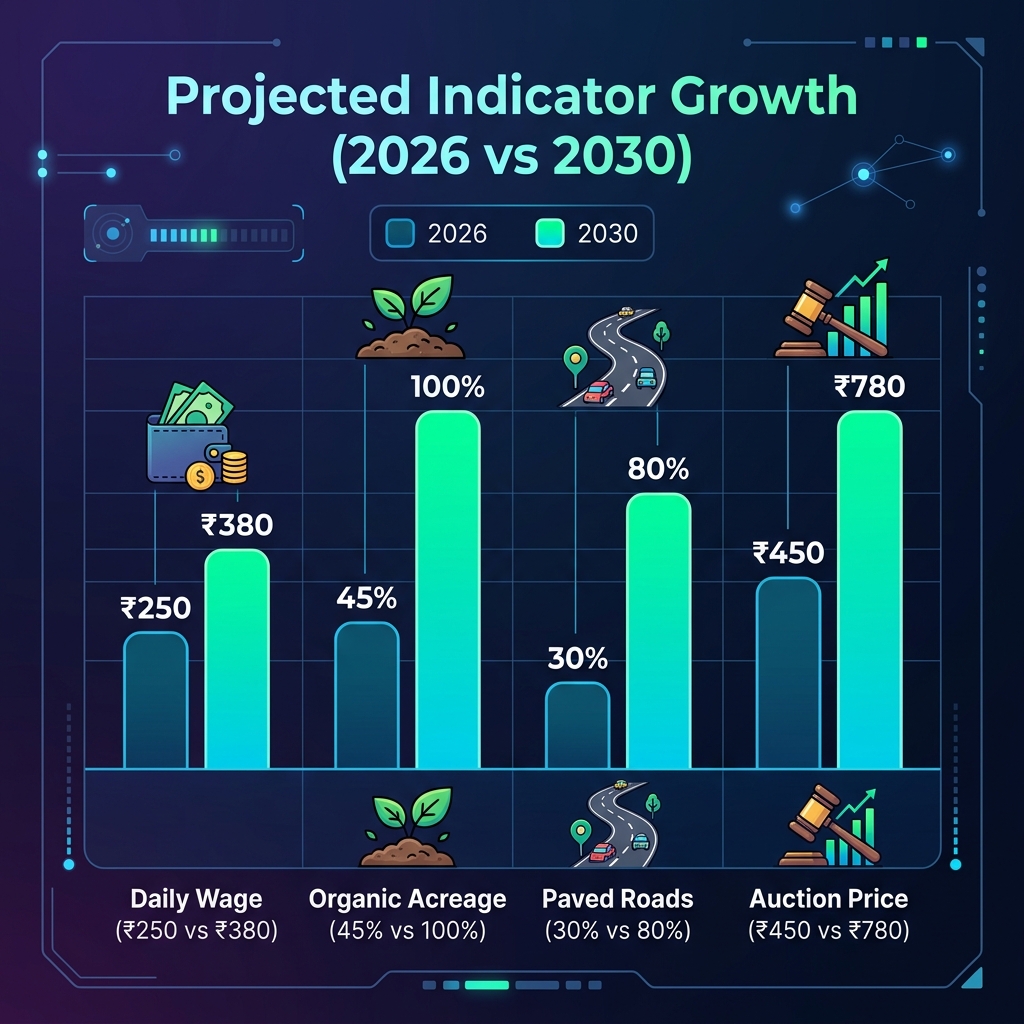
Proposed Phased Development Model
Financial projections, public-private investment, and societal impact forecast
Phase I focuses on wage restructuring, organic fertilizer subsidies, and reopening closed estates. Phase II deploys smart irrigation, drone surveillance, and colonial bungalow tourist upgrades. Phase III drives direct-to-consumer digital auction frameworks and organic tea cosmetics export.
Capital Expenditure Breakdown
- Factory Modernisation & Solar Roofs: ₹35 Cr (23.3%)
- Worker Housing Rehabilitation & Sanitation: ₹30 Cr (20.0%)
- Water Table & Drip Irrigation Reservoirs: ₹25 Cr (16.7%)
- Slope Terracing & Vetiver Grass Barriers: ₹20 Cr (13.3%)
- Specialized Ropeways & Local Road Upgrades: ₹15 Cr (10.0%)
- Digital Auction Platform & Blockchain GI Track: ₹15 Cr (10.0%)
- Organic Nursery Replanting (Clonal clones): ₹10 Cr (6.7%)
Projected Financial Metrics
Net Present Value (NPV): ₹42.5 Crore (at 10% discount rate)
Internal Rate of Return (IRR): 16.4% over 8 years
Est. Payback Period: 5.2 Years
Achieving long-term sustainability requires moving from simple volume extraction to high-margin quality focus:
- Optimal Labor Allocation (Men): Training pluckers in precision "fine plucking" (one bud and two leaves) to maximize first-flush auction value while maintaining fair-wage standards.
- Optimal Biomass Recovery (Material): Generating organic vermicompost using green tea prunings and cattle manure. Deploys local bio-digesters to power factory workers' housing lines.
- Optimal Land Cover (Area): Intercropping tea bushes with deep-rooted shade trees (Albizia, Erythrina) and Vetiver grass hedges on steep slopes. This prevents topsoil run-off and retains rain water.
Key infrastructure additions to bridge remote estates with high-margin buyers:
- Paved Connector Roads: Upgrading 120 km of muddy paths to all-weather bitumen roads, reducing transport leaf-bruising during transit.
- Himalayan Ropeways: Setting up gravity-assisted ropeway cables to transport fresh green leaves from high valleys (like Happy Valley) to factories, cutting carbon emissions by 40%.
- Digital & Mobile Connectivity: Implementing 4G/5G mobile towers inside remote estates to enable real-time field-to-mill weighing data and digital auctions.
Transforming worker settlements into thriving model communities:
- Labor Housing Upgrades: Retrofitting 12,000 workers' quarters with reinforced brick walls, metal roofing, and private sanitation toilets.
- Smart Schools & Education: Funding 24 primary school centers inside gardens with computer labs, digital learning, and vocational training to curb youth out-migration.
- Children's Nutrition & Healthcare: Introducing daily nutritional supplements (to battle iron-deficiency anaemia) and deploying mobile wellness clinics for maternal care.